
| |
Market Indices | |
At-A-Glance | |
| |
October 2020 | |
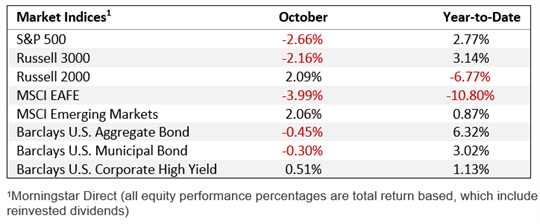
All three major U.S. equity averages capped their first back-to-back monthly loss since the depths of the pandemic sell-off in March. Moreover, the S&P 500 had its worst October second-half performance (-6.10%) since a 10.68% correction in 1987. October angst was caused by fears for a second wave of virus-induced national lockdowns, a breakdown in fiscal stimulus negotiations, and uneven earnings data, especially among mega cap tech stocks. Month-ending COVID-19 daily infections reached a record 99,300 on the last trading day of the month. Improving economic data helped mitigate deeper losses. Weekly jobless claims declined 40,000 to 751,000 in the last reporting week of October, the fewest since mid-March. Continuing claims fell a fifth straight week, down 709,000 to 7.76 million. Manufacturing activity climbed to a two-year high and an advance reading of 3Q GDP surged at a record-setting 33.1% annualized pace (+7.4% Q/Q). Strong consumer spending drove the rebound, up a record 40.7%, surpassing first quarter spending levels. Small and mid cap stocks outperformed large caps last month. The Russell 2000 small cap-focused index gained nearly 2.1%, while the Russell Mid Cap Index trailed, up just 0.64%. Large cap Value stocks also outperformed in October, down 1.31% whereas their Growth counterparts retreated more than twice as much (-3.40%). However, Growth-oriented equities are still outpacing Value for the year, up 20.11% YTD while Value is down 12.74% YTD. As the performance table illustrates below, only two of the 11 major equity sectors ended positive last month, led by an outsized gain in Utilities, a classic defensive group. Technology, Consumer Discretionary, and Communication Services remain this year’s best performers, while Energy continues as the worst performing sector, down over 50% YTD. Foreign equity markets had mixed returns in October and continue to trail U.S. performance on a year-to-date basis. Emerging markets widely outperformed relative to the U.S. benchmark S&P 500 with a positive differential of over 4.7%. Developed markets outside the U.S. and Canada fell nearly 4% as viral infections prompted Germany and the U.K. to lay plans for national quarantines. Globally, the MSCI All-Country World Index fell 2.4% in October, while the same index excluding the USA lost 2.2%. U.S. Treasury yields rose in October, particularly at the long end of the curve as traders priced in growing prospects for a Democratic sweep in Tuesday’s elections. The yield on benchmark 10-year notes rose 12 basis points to end the month at 0.85%. Treasurys of all maturities, as measured by the Bloomberg Barclays U.S. Government Index fell 0.92%, while the longer-term government bond index slumped 2.98%. Bond yield prices move in opposite direction to yields, so when yields improve, price returns drop. Investment-grade bonds of all types lost nearly 0.50%. Meanwhile, municipal bonds slipped just 0.30%. Lastly, higher-risk, non-investment grade high-yield corporate bonds performed best, rebounding about half of its 1% prior-month loss. U.S. WTI crude oil tumbled over 11% in October to finish at $35.79/barrel as fears for renewed national lockdowns shocked global demand prospects. Gold finished the month down 0.8%, its third consecutive monthly decline. The Bloomberg Commodities Index gained 1.4% last month. | |
Top & Bottom Performers | |
 | |
 | |
This report is created by Cetera Investment Management LLC. For more insights and information from the team, follow @CeteraIM on Twitter. About Cetera® Investment Management About Cetera Financial Group Disclosures Individuals affiliated with Cetera firms are either Registered Representatives who offer only brokerage services and receive transaction-based compensation (commissions), Investment Adviser Representatives who offer only investment advisory services and receive fees based on assets, or both Registered Representatives and Investment Adviser Representatives, who can offer both types of services. The material contained in this document was authored by and is the property of Cetera Investment Management LLC. Cetera Investment Management provides investment management and advisory services to a number of programs sponsored by affiliated and non-affiliated registered investment advisers. Your registered representative or investment adviser representative is not registered with Cetera Investment Management and did not take part in the creation of this material. He or she may not be able to offer Cetera Investment Management portfolio management services. Nothing in this presentation should be construed as offering or disseminating specific investment, tax, or legal advice to any individual without the benefit of direct and specific consultation with an investment adviser representative authorized to offer Cetera Investment Management services. Information contained herein shall not constitute an offer or a solicitation of any services. Past performance is not a guarantee of future results. For more information about Cetera Investment Management, please reference the Cetera Investment Management LLC Form ADV disclosure brochure and the disclosure brochure for the registered investment adviser your adviser is registered with. Please consult with your adviser for his or her specific firm registrations and programs available. No independent analysis has been performed and the material should not be construed as investment advice. Investment decisions should not be based on this material since the information contained here is a singular update, and prudent investment decisions require the analysis of a much broader collection of facts and context. All information is believed to be from reliable sources; however, we make no representation as to its completeness or accuracy. The opinions expressed are as of the date published and may change without notice. Any forward-looking statements are based on assumptions, may not materialize, and are subject to revision. All economic and performance information is historical and not indicative of future results. The market indices discussed are not actively managed. Investors cannot directly invest in unmanaged indices. Please consult your financial advisor for more information. Additional risks are associated with international investing, such as currency fluctuations, political and economic instability, and differences in accounting standards. Glossary The Bloomberg Barclays Capital U.S. Aggregate Bond Index, is a broad based flagship benchmark that measures the investment grade, US dollar-denominated, fixed-rate taxable bond market. The index includes Treasuries, government–related and corporate debt securities, MBS (agency fixed-rate and hybrid ARM pass-throughs), ABS and CMBS (agency and non-agency) debt securities that are rated at least Baa3 by Moody’s and BBB- by S&P. Taxable municipals, including Build America bonds and a small amount of foreign bonds traded in U.S. markets are also included. The Bloomberg Barclays US Municipal Bond Index covers the USD-denominated long-term tax exempt bond market. The index has four main sectors: state and local general obligation bonds, revenue bonds, insured bonds, and prerefunded bonds. Eligible securities must be rated investment grade (Baa3/BBB- or higher) by Moody’s and S&P and have at least one year until final maturity, but in practice the index holding have a fluctuating average life of around 12.8 years. The Bloomberg Barclays US Corporate High Yield Index measures the USD-denominated, non-investment grade, fixed-rate, taxable corporate bond market. Securities are classified as high yield if the middle rating of Moody's, Fitch, and S&P is Ba1/BB+/BB+ or below, excluding emerging market debt. Payment-in-kind and bonds with predetermined step-up coupon provisions are also included. Eligible securities must have at least one year until final maturity, but in practice the index holdings has a fluctuating average life of around 6.3 years. The Barclays U.S. Government Bond Index is comprised of the U.S. Treasury and U.S. Agency Indices. The index includes U.S. dollar-denominated, fixed-rate, nominal US Treasuries and US agency debentures (securities issued by US government owned or government sponsored entities, and debt explicitly guaranteed by the US government). The Bloomberg Commodity Index is a broadly diversified index that allows investors to track commodity futures through a single, simple measure. It is composed of futures contracts on physical commodities and is designed to minimize concentration in any one commodity or sector. It currently includes 19 commodity futures in five groups. No one commodity can comprise less than 2% or more than 15% of the index, and no group can represent more than 33% of the index (as of the annual reweightings of the components). The Cboe Volatility Index® (VIX®) is a key measure of market expectations of near-term volatility conveyed by S&P 500 stock index option prices. The MSCI EAFE is designed to measure the equity market performance of developed markets (Europe, Australasia, Far East) excluding the U.S. and Canada. The Index is market-capitalization weighted. The MSCI Emerging Markets is designed to measure equity market performance in global emerging markets. It is a float-adjusted market capitalization index. The MSCI All-Country World Index (ACWI) is a market cap weighted index designed to represent performance of the full opportunity set of large- and mid-cap stocks across 23 developed and 26 emerging markets, covering more than 2,700 companies across 11 sectors and approximately 85% of the free float-adjusted market capitalization in each market. The Russell 1000 Growth Index measures the performance of the large-cap growth segment of the U.S. equity universe. It includes those Russell 1000 Index companies with higher price-to-book ratios and higher forecasted growth values. The Russell 1000 Value Index measures the performance of the large-cap value segment of the U.S. equity universe. It includes those Russell 1000 Index companies with lower price-to-book ratios and lower forecasted growth values. The Russell 2000 Index measures the performance of the small-cap segment of the U.S. equity universe and is a subset of the Russell 3000 Index representing approximately 10% of the total market capitalization of that index. It includes approximately 2000 of the smallest securities based on a combination of their market cap and current index membership. The Russell 3000 Index measures the performance of the largest 3,000 U.S. companies representing approximately 98% of the investable U.S. equity market. The Russell Midcap Index measures the performance of the mid-cap segment of the U.S. equity universe and is a subset of the Russell 1000 Index. It includes approximately 800 of the smallest securities based on a combination of their market cap and current index membership. The Russell Midcap represents approximately 31% of the total market capitalization of the Russell 1000 companies. The S&P BSE SENSEX Index is a free-float market-weighted index of 30 well-established and financially sound stocks on the Bombay Stock Exchange, representative of various industrial sectors of the Indian economy. The S&P 500 is a capitalization-weighted index of 500 stocks designed to measure performance of the broad domestic economy through changes in the aggregate market value of 500 stocks representing all major industries. The Dow Jones Industrial Average is a price-weighted average of 30 significant stocks traded on the New York Stock Exchange and the NASDAQ. The NASDAQ Composite Index includes all domestic and international based common type stocks listed on The NASDAQ Stock Market. The NASDAQ Composite Index is a broad-based capitalization-weighted index. The Shanghai Composite Index is a stock market index of all stocks (A shares and B shares) that are traded at the Shanghai Stock Exchange. The U.S. Dollar Index is a weighted geometric mean that provides a value measure of the United States dollar relative to a basket of major foreign currencies. The index, often carrying a USDX or DXY moniker, started in March 1973, beginning with a value of the U.S. Dollar Index at 100.000. It has since reached a February 1985 high of 164.720, and has been as low as 70.698 in March 2008. West Texas Intermediate (WTI) is a crude oil stream produced in Texas and southern Oklahoma which serves as a reference or "marker" for pricing a number of other crude streams. WTI is the underlying commodity of the New York Mercantile Exchange's oil futures contracts. |
Monthly Recap | October 2020
November 03, 2020