
| |
| |
At-A-Glance | |
| |
March & First Quarter 2022 | |
U.S. stocks finished the month and quarter on a sour note with the broad market S&P 500 falling nearly 1.6% on the final trading day of March, trimming its first monthly gain in the new year to just over 3.7% and posting its first quarterly loss in two years. In terms of negativity, there were a total of 35 down days this year, marking the largest number of first quarter daily drawdowns since 1984. Nearly half (17) of those daily losses were in excess of 1%. Equities notably improved in the second half of March, paring a dismal start to the year. At its worst through a March 8 low, the S&P 500 had suffered a peak-to-trough plunge of as much as 13% before paring losses. Since then, there has been a growing optimism that stocks may serve to help hedge against inflation, due to their real cash-flow generating characteristics. In all, despite four-decade high inflation ushering in a new cycle of Federal Reserve interest rate hikes, erosion in consumer spending together with supply-chain disruptions and prospects for food shortages worsened by the month-long Russian war with Ukraine, the S&P 500 suffered a quarterly loss of just 4.60%. The retreat pales in comparison when contrasted with the thousands of lives lost, property and livelihoods destroyed and resulting refugee dislocations within a nation that did not provoke, nor prod Russia to attack. Moreover, for U.S. markets, it was the onset of the COVID-19 pandemic that triggered the 20% bear market loss in the first quarter of 2020. An event that continues to have an expanding global death toll most recently estimated at 6.14 million. Referencing the performance table above, the small cap-focused Russell 2000 Index widely trailed the benchmark S&P 500 with about a third of the returns in March and almost 3% greater losses for the quarter. Similarly, foreign stocks also widely trailed American large cap performance in March and for the quarter. Quickly paced Treasury yield gains have especially caused concerns in investment-grade fixed-income bond market valuations. As shown in the style box performance boxes below, large cap core and its growth component outperformed all other domestic styles and capitalization levels in March. Outside of that, value defensively outperformed growth-oriented companies in mid and small cap levels last month and for the quarter. | |
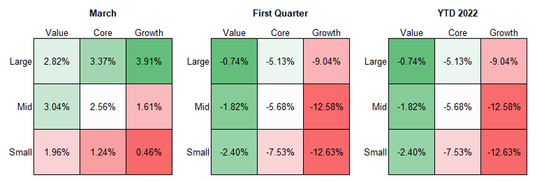 | |
Morningstar Direct Style Box Index returns above are represented by: Large Value (Russell 1000 Value), Large Core (Russell 1000), Large Growth (Russell 1000 Growth), Mid Value (Russell Mid Cap Value), Mid Core (Russell Mid Cap), Mid Growth (Russell Mid Cap Growth), Small Value (Russell 2000 Value), Small Core (Russell 2000), Small Growth (Russell 2000 Growth). Source: Morningstar Direct, total return based, including reinvested dividends | |
Top & Bottom Performers | |
In the sector performance tables below, 10 of the 11 major sector groups ended broadly higher in March, with Utilities at the top of the leaderboard and Financials the only declining sector. Big investment banks are contending with a slowdown in capital markets issuance. Although not reflected below, Materials was the fourth-best performing sector last month, up 6.11%. First quarter sector performance was dominated by strong gains in Energy, a reflection of the 33% YTD surge in crude oil prices. U.S. WTI oil prices have moderated from a March 8 closing high of $123.70 before ending the quarter at $100.28/barrel. Defensively oriented sectors Utilities and Consumer Staples rounded out the list of top first quarter performers. | |
 | |
As mentioned, overseas equity performance widely trailed the U.S. S&P 500 Index last quarter. Emerging markets experienced deeper quarterly losses than the U.S. as Chinese stocks tumbled on U.S. delisting fears. The MSCI China Index saw its worst quarterly start to a year since 2008, down 14.19%. Moreover, Russian markets were closed most of March, causing performance tracking firms to report 100% Russian equity valuation declines to reflect inability to trade (zero liquidity). The MSCI All-Country World Index climbed 2.17% in March and fell 5.36% during the first quarter. The ACWI excluding U.S. performance rose just 0.16% last month and fell 5.44% last quarter. U.S. Treasurys, as measured by the Bloomberg U.S. Government Bond Index, fell 3.09% in March and lost 5.53% in the first quarter. After the Fed raised its key Fed Funds interest rate by a ¼-point in March with at least seven more such increases forecast this year, the yield on benchmark 10-year Treasury notes jumped 83 basis points from 1.51% at the start of the year to 2.32% at the end of the quarter. The long end of the yield curve suffered deeper declines, with the Bloomberg U.S. Government Long-term Bond Index falling 5.34% last month and posted a 10.57% loss for the first quarter. In other fixed-income assets, investment-grade bonds of all types (as measured by the Bloomberg U.S. Aggregate Bond Index) also ended March and the quarter with outsized losses, sliding nearly 2.8% last month and down over 5.9% for the quarter. Municipal bonds fared even worse, losing around 3.2% in March and almost twice that for the quarter, down 6.2%. Non-investment-grade high-yield debt fell the least in March, with the Bloomberg U.S. Corporate High Yield Index off nearly 1.2% and down over 4.8% in the first quarter. | |
 | |
This report is created by Cetera Investment Management LLC. For more insights and information from the team, follow @CeteraIM on Twitter. About Cetera® Investment Management About Cetera Financial Group Disclosures Individuals affiliated with Cetera firms are either Registered Representatives who offer only brokerage services and receive transaction-based compensation (commissions), Investment Adviser Representatives who offer only investment advisory services and receive fees based on assets, or both Registered Representatives and Investment Adviser Representatives, who can offer both types of services. The material contained in this document was authored by and is the property of Cetera Investment Management LLC. Cetera Investment Management provides investment management and advisory services to a number of programs sponsored by affiliated and non-affiliated registered investment advisers. Your registered representative or investment adviser representative is not registered with Cetera Investment Management and did not take part in the creation of this material. He or she may not be able to offer Cetera Investment Management portfolio management services. Nothing in this presentation should be construed as offering or disseminating specific investment, tax, or legal advice to any individual without the benefit of direct and specific consultation with an investment adviser representative authorized to offer Cetera Investment Management services. Information contained herein shall not constitute an offer or a solicitation of any services. Past performance is not a guarantee of future results. For more information about Cetera Investment Management, please reference the Cetera Investment Management LLC Form ADV disclosure brochure and the disclosure brochure for the registered investment adviser your adviser is registered with. Please consult with your adviser for his or her specific firm registrations and programs available. No independent analysis has been performed and the material should not be construed as investment advice. Investment decisions should not be based on this material since the information contained here is a singular update, and prudent investment decisions require the analysis of a much broader collection of facts and context. All information is believed to be from reliable sources; however, we make no representation as to its completeness or accuracy. The opinions expressed are as of the date published and may change without notice. Any forward-looking statements are based on assumptions, may not materialize, and are subject to revision. All economic and performance information is historical and not indicative of future results. The market indices discussed are not actively managed. Investors cannot directly invest in unmanaged indices. Please consult your financial advisor for more information. Additional risks are associated with international investing, such as currency fluctuations, political and economic instability, and differences in accounting standards. Glossary The Bloomberg Barclays Capital U.S. Aggregate Bond Index, is a broad based flagship benchmark that measures the investment grade, US dollar-denominated, fixed-rate taxable bond market. The index includes Treasuries, government–related and corporate debt securities, MBS (agency fixed-rate and hybrid ARM pass-throughs), ABS and CMBS (agency and non-agency) debt securities that are rated at least Baa3 by Moody’s and BBB- by S&P. Taxable municipals, including Build America bonds and a small amount of foreign bonds traded in U.S. markets are also included. The Bloomberg Barclays US Municipal Bond Index covers the USD-denominated long-term tax exempt bond market. The index has four main sectors: state and local general obligation bonds, revenue bonds, insured bonds, and prerefunded bonds. Eligible securities must be rated investment grade (Baa3/BBB- or higher) by Moody’s and S&P and have at least one year until final maturity, but in practice the index holding have a fluctuating average life of around 12.8 years. The Bloomberg Barclays US Corporate High Yield Index measures the USD-denominated, non-investment grade, fixed-rate, taxable corporate bond market. Securities are classified as high yield if the middle rating of Moody's, Fitch, and S&P is Ba1/BB+/BB+ or below, excluding emerging market debt. Payment-in-kind and bonds with predetermined step-up coupon provisions are also included. Eligible securities must have at least one year until final maturity, but in practice the index holdings has a fluctuating average life of around 6.3 years. The Barclays U.S. Government Bond Index is comprised of the U.S. Treasury and U.S. Agency Indices. The index includes U.S. dollar-denominated, fixed-rate, nominal US Treasuries and US agency debentures (securities issued by US government owned or government sponsored entities, and debt explicitly guaranteed by the US government). The Bloomberg Commodity Index is a broadly diversified index that allows investors to track commodity futures through a single, simple measure. It is composed of futures contracts on physical commodities and is designed to minimize concentration in any one commodity or sector. It currently includes 19 commodity futures in five groups. No one commodity can comprise less than 2% or more than 15% of the index, and no group can represent more than 33% of the index (as of the annual reweightings of the components). The Cboe Volatility Index® (VIX®) is a key measure of market expectations of near-term volatility conveyed by S&P 500 stock index option prices. The MSCI EAFE is designed to measure the equity market performance of developed markets (Europe, Australasia, Far East) excluding the U.S. and Canada. The Index is market-capitalization weighted. The MSCI Emerging Markets is designed to measure equity market performance in global emerging markets. It is a float-adjusted market capitalization index. The MSCI All-Country World Index (ACWI) is a market cap weighted index designed to represent performance of the full opportunity set of large- and mid-cap stocks across 23 developed and 26 emerging markets, covering more than 2,700 companies across 11 sectors and approximately 85% of the free float-adjusted market capitalization in each market. The Russell 1000 Growth Index measures the performance of the large-cap growth segment of the U.S. equity universe. It includes those Russell 1000 Index companies with higher price-to-book ratios and higher forecasted growth values. The Russell 1000 Value Index measures the performance of the large-cap value segment of the U.S. equity universe. It includes those Russell 1000 Index companies with lower price-to-book ratios and lower forecasted growth values. The Russell 2000 Index measures the performance of the small-cap segment of the U.S. equity universe and is a subset of the Russell 3000 Index representing approximately 10% of the total market capitalization of that index. It includes approximately 2000 of the smallest securities based on a combination of their market cap and current index membership. The Russell 3000 Index measures the performance of the largest 3,000 U.S. companies representing approximately 98% of the investable U.S. equity market. The Russell Midcap Index measures the performance of the mid-cap segment of the U.S. equity universe and is a subset of the Russell 1000 Index. It includes approximately 800 of the smallest securities based on a combination of their market cap and current index membership. The Russell Midcap represents approximately 31% of the total market capitalization of the Russell 1000 companies. The S&P BSE SENSEX Index is a free-float market-weighted index of 30 well-established and financially sound stocks on the Bombay Stock Exchange, representative of various industrial sectors of the Indian economy. The S&P 500 is a capitalization-weighted index of 500 stocks designed to measure performance of the broad domestic economy through changes in the aggregate market value of 500 stocks representing all major industries. The Dow Jones Industrial Average is a price-weighted average of 30 significant stocks traded on the New York Stock Exchange and the NASDAQ. The NASDAQ Composite Index includes all domestic and international based common type stocks listed on The NASDAQ Stock Market. The NASDAQ Composite Index is a broad-based capitalization-weighted index. The Shanghai Composite Index is a stock market index of all stocks (A shares and B shares) that are traded at the Shanghai Stock Exchange. The U.S. Dollar Index is a weighted geometric mean that provides a value measure of the United States dollar relative to a basket of major foreign currencies. The index, often carrying a USDX or DXY moniker, started in March 1973, beginning with a value of the U.S. Dollar Index at 100.000. It has since reached a February 1985 high of 164.720, and has been as low as 70.698 in March 2008. West Texas Intermediate (WTI) is a crude oil stream produced in Texas and southern Oklahoma which serves as a reference or "marker" for pricing a number of other crude streams. WTI is the underlying commodity of the New York Mercantile Exchange's oil futures contracts. |

Monthly Recap | March 2022
April 04, 2022